
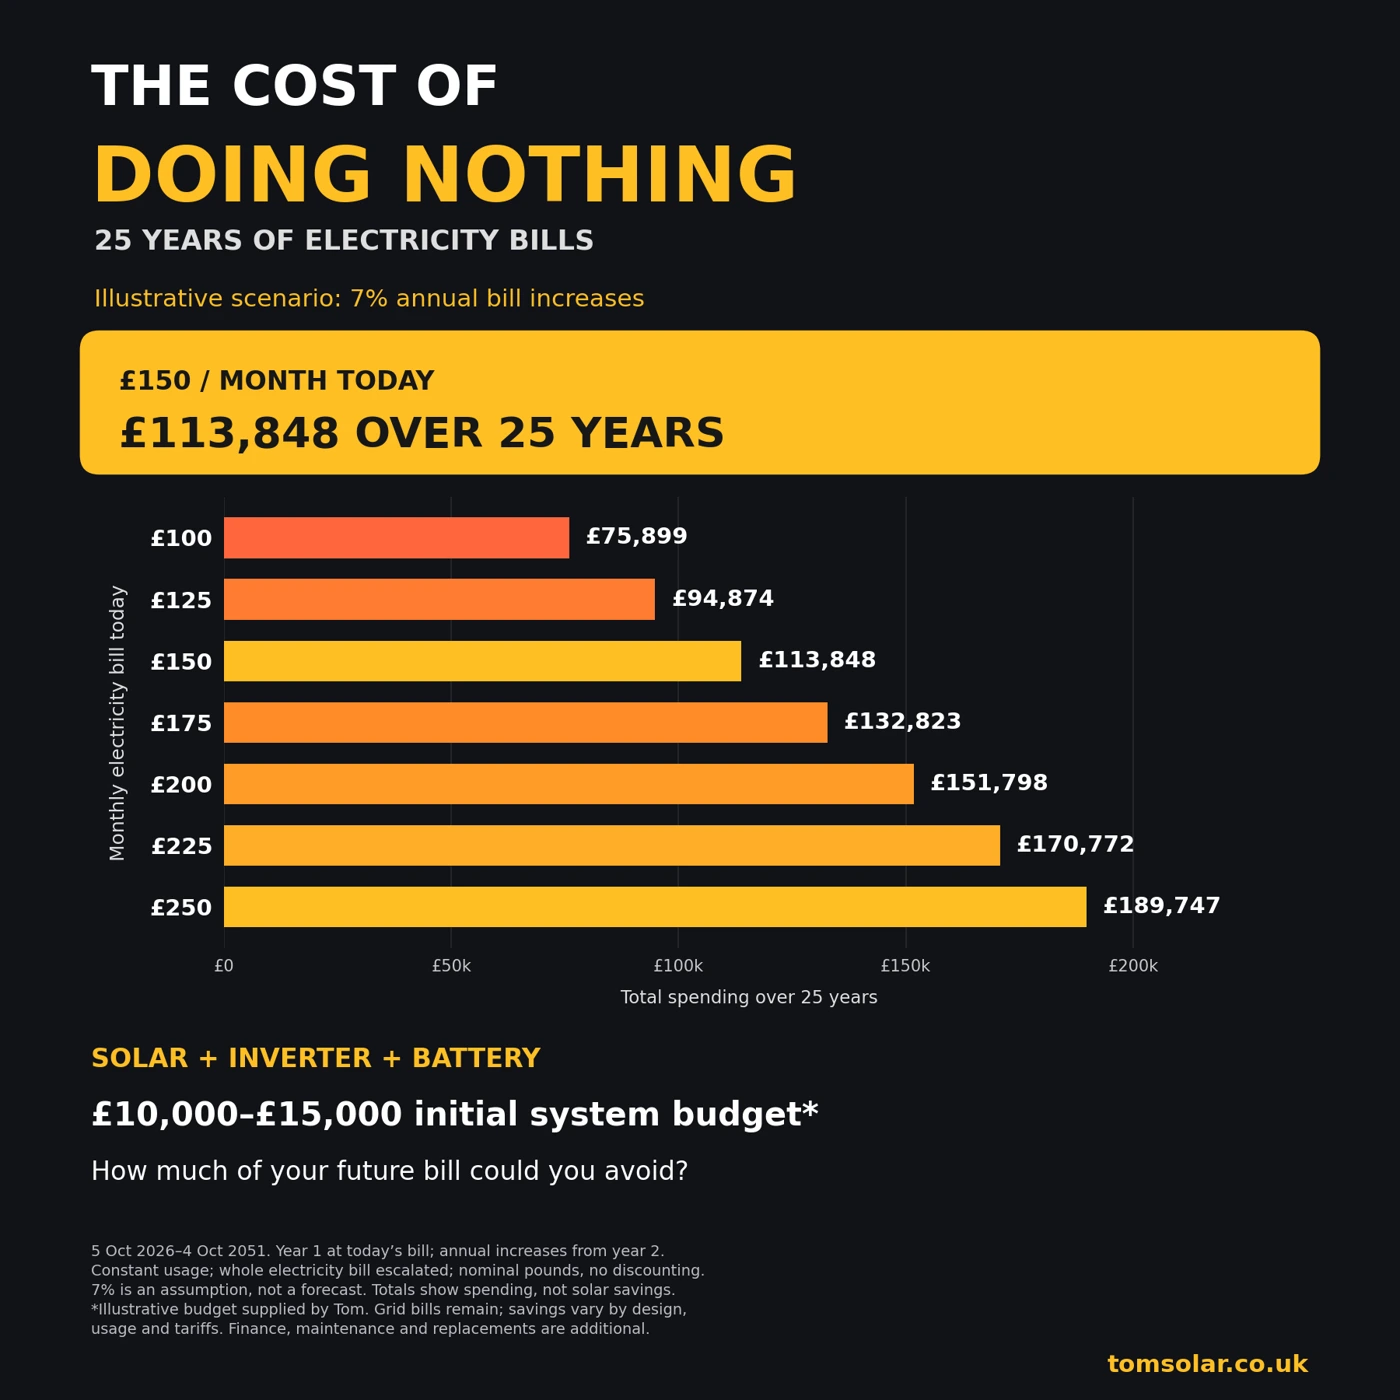
Even if it never rises, £150 a month adds up to £45,000 over 25 years. With an illustrative 7% annual increase, the total becomes £113,848. A suitable solar and battery system can avoid part of future electricity spending, but the entire bill is not a saving.
What could my electricity bills add up to?
The table compares unchanged bills with the 7% annual-increase scenario used in today's chart. Both assume the same electricity use throughout. These are future cash totals, not values discounted into today's money.
| Monthly bill today | No annual increase | 7% annual increase |
|---|---|---|
| £100 | £30,000 | £75,899 |
| £125 | £37,500 | £94,874 |
| £150 | £45,000 | £113,848 |
| £175 | £52,500 | £132,823 |
| £200 | £60,000 | £151,798 |
| £225 | £67,500 | £170,772 |
| £250 | £75,000 | £189,747 |
A monthly direct debit may differ from actual consumption costs. Start with your annual electricity usage and tariff, and separate electricity from gas or other fuels before assessing solar.
Are UK solar installations doubling every year?
No: that claim overstates the evidence. Government figures published in May 2026 report 269,000 UK solar installations in 2025, up 37% on the previous year.
In its 14 September update, Solar Energy UK reported 207,619 MCS-certified installations recorded in 2026 and projected around 300,000 by year-end if the trend held. That is a projection, not a completed annual result.
New-build requirements also contribute to growth. These figures cover more than homeowners choosing retrofits, so they should not be presented as a count of existing households independently deciding to buy solar.
Why are people investing in solar and battery storage?
For a suitable property, the attraction is straightforward: generate some electricity at home and buy less from the grid. Electricity you generate and use replaces purchases at the applicable import rate.
A battery can store surplus daytime generation for the evening. With compatible equipment and an eligible time-of-use tariff, it can also charge off-peak and serve the home during more expensive hours. The Energy Saving Trust explains these uses and their limitations.
That gives a household more control over when it buys electricity and reduces exposure to prices on the energy it no longer needs to purchase. It does not guarantee energy independence, eliminate standing charges or make winter imports disappear.
Storage needs to match both energy demand and power demand. Charging time, capacity, losses, equipment compatibility and tariff eligibility all matter. See how to choose battery size and how to compare tariffs.
How do I compare a £10,000–£15,000 system?
The chart uses an illustrative initial budget of £10,000–£15,000 for panels, an inverter and storage. It is not a quotation or a universal price: the actual specification, roof and installation determine the cost.
Compare a household-specific estimate of avoided electricity purchases with the full cost of ownership. Include remaining imports, standing charges, charging losses, maintenance, potential battery and inverter replacements and any finance charges. Keep export income separate so the bill-saving case is clear.
Gross bill savings are the difference between the modelled electricity bill without the system and the modelled bill with it, before deducting system ownership costs. Net benefit then deducts those ownership costs. Subtracting £15,000 from the entire projected bill would wrongly assume the system removes every future payment.
A strong proposal should remain understandable when the assumptions are less favourable. Read how your bill affects payback and why payback estimates differ.
Why consider investing now?
You do not need to predict the next energy crisis to assess a system. Once a suitable installation is operating, it can start replacing grid purchases. Waiting means continuing to purchase energy it could have supplied during that period.
But acting now only makes sense when the roof, design, expected savings and affordability support the decision. A forthcoming roof repair, a short remaining time in the home or an unsuitable installation location may change the answer.
Take your monthly bill. Look beyond the next payment. Then find out what a properly designed system could change.
What assumptions sit behind the chart?
- Year one is charged at today's monthly bill, multiplied by 12. Bills increase by 7% at each subsequent anniversary.
- The calculation is monthly bill × 12 × [(1.0725 − 1) ÷ 0.07].
- Usage stays constant, and the whole electricity bill is escalated for simplicity, including any standing charge already in that starting bill.
- 7% is an illustrative assumption, not an official guaranteed forecast or a claimed industry standard.
- The totals are nominal spending without discounting. No installation saving, export income or equipment cost is deducted.
The no-increase column shows that a substantial lifetime bill exists even without the inflation assumption. A real proposal needs its own documented assumptions rather than relying on this illustration.